VN1 Forecasting Competition — What I Learned from the Best Forecasters
I had the pleasure to host the VN1 Forecasting Competition from September to October 2024, with around 250 participants (or teams) actively participating. The objective of the competition was to forecast the sales of different e-vendors for the next 13 weeks (for a total of around 15,000 combinations; the dataset was provided by one of our three sponsors, Flieber). The competition was spread into two phases; the first one was a warm-up where competitors could try out different models, see their scores, and compare with other participants, whereas the second phase was the real competition where competitors could only submit a single set of forecasts and couldn’t see their scores until the final deadline.

As the competition closed, I took the time to gather insights from the top 20 competitors. I had the pleasure of discussing their approaches, difficulties, and solutions with them. Later, in November, I hosted a webinar in which the top 5 winners shared their approaches.
In this article, I share my learning points from the competition.
Technical note: The quality of the submissions was evaluated using the “score” (score = MAE% + |Bias%|), a metric I implement for all my clients as it offers an excellent tradeoff between metric complexity and business value. You can read more about it in my books Data Science for Supply Chain Forecasting and Demand Forecasting Best Practices.

Disclaimer: most of my takeaways are based on self-reported information from the top 20 participants and my conversations with them. Despite my best efforts, some information could have been lost along the way or misinterpreted.
Beating Simple Models
In the competition setup, I provided competitors with a benchmark function to generate a 12-week moving average. Most competitors could beat it (see that in Phase 2, the benchmark achieved a score of 80.5%, whereas the top 20 competitors were all below 53%). But the main surprise of the competition is that only a few competitors could beat a naïve forecast, which achieved a score of 50.7%. Naïve forecasts resulted in much better forecasts than moving averages for Phase 2 because of the seasonality: moving averages included Phase 1 year-end sales, which resulted in over forecasts for Phase 2. If the results would have been evaluated a few weeks later, it’s unlikely that a naïve forecast would have performed as well.
One competitor understood this and, after trying out multiple models, decided to bravely stick to naïve and achieved 12th position. No one achieved a good score at VN1 by casually providing a naïve forecast: top competitors tried out multiple models before choosing their final solution. It took skill and knowledge to understand that a solution as simple as naïve delivered good results. Assessing the value of naïve forecasts wasn’t obvious: among the 250+ participants, only one concluded from his analysis that naïve was delivering better accuracy than (most) other methods.
Note that it’s (extremely) unusual for naïve forecasts to beat moving averages. That’s why I advise against using naïve forecasts as benchmarks, as they are too easy to beat.
The Key Skill: Assessing Models
Based on my interviews with top competitors, their main skill was being able to evaluate, fine-tune, and select models easily. Most of them tried out different approaches, features, and parameters — None got simply lucky at trying out a model that was successful by default. The key here is to iterate quickly using a robust testing framework (in the sense that if a model delivers good results in your setup, it is also very likely to deliver good results in the future).

Insights from Top Competitors
Let’s start with a few insights and then discuss the types of models the competitors used.
- Tools. All the top participants but one used the programming language Python (and its multiple libraries) to analyze the data and create their forecasts. No one reported using Excel, VBA, Matlab or SQL. Most participants used Pandas (a library within Python) to manipulate data (with a few going for Polars, a faster but lesser-known alternative), and half reported using Nixtla’s models or util functions.
My advice for anyone who wants to do forecasting at scale is to learn Python and skip Excel, VBA, Matlab, and SQL. - Outlier detection. Only two participants reported flagging outliers. I personally don’t use any statistical method to flag outliers, and I don’t advise my clients to do so. Last year, I published an article and hosted a webinar to explain why I don’t detect outliers and what I do instead.
- Shortage and zeroes. Three participants reported flagging shortages or end-of-life products. Unfortunately, the competition didn’t use inventory data to automatically flag shortages, so we couldn’t demonstrate the importance of using inventory data. I will do my best to include this in my next competition (VN2). Even when my clients don’t provide me with their historical inventory data, I still spend time flagging shortages and end-of-life: simple methods usually provide tangible added value.
- Segmentation. A few participants segmented products. Most often, the segmentation was based on seasonal patterns.
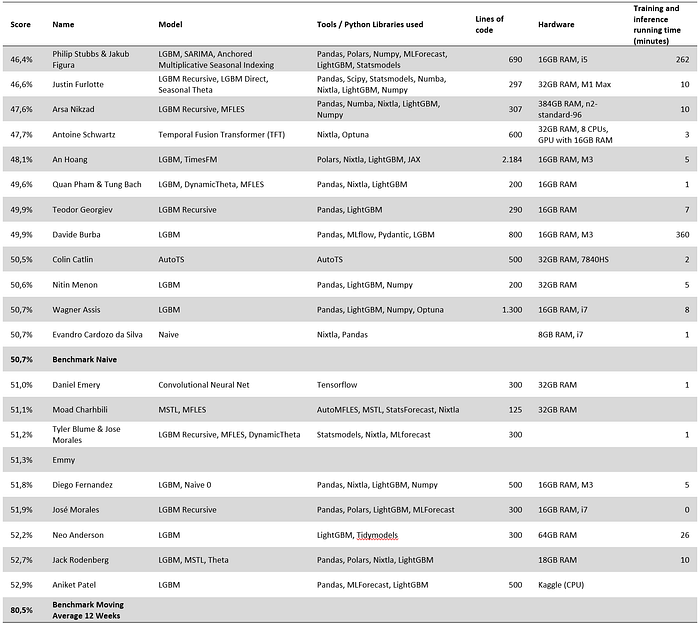
- Code Complexity. Half of the participants delivered a solution in less than 300 lines of code. This highlights that if you know what you are doing, you can deliver high value with little complexity. Code complexity is also dependent on the libraries used and if the participants included the code required to optimize their models.
Putting models in production in a live environment will also likely require more code to enhance robustness and cope with most edge cases. Moreover, the participants received structured data and didn’t have to deal with promotions and shortages. - Running time. Nearly all solutions could deliver forecasts within 10 minutes — machine learning is definitely fast. Only two teams reported much longer running time. The (winning) team provided forecasts in 4h30 due to their use of ARIMA (a famously slow model — I will come back to this later). The second “slow” model was because the participant squeezed extra accuracy by ensembling his model 30 times (in other words, he ran his model 30 times).
- Parameter Optimization. Most machine learning models need hyperparameter tuning. Nevertheless, some competitors stuck to using their models’ library default, whereas others took up to 200 hours of cross-validation time to optimize them. It is a surprise that using default values didn’t impact the accuracy of some models much.
Feature engineering seems to be more important than parameter optimization.
Models
VN1 — like most data science competitions — is a social competition: people share ideas and notebooks and communicate. So, there is an organic aspect to the models that end up being used in the competition. It’s likely that if someone shared a notebook achieving a reasonable score on day one, many competitors would have used it. Competitors have limited time, so if they find a working technique and a ready-to-use notebook, they will use it.
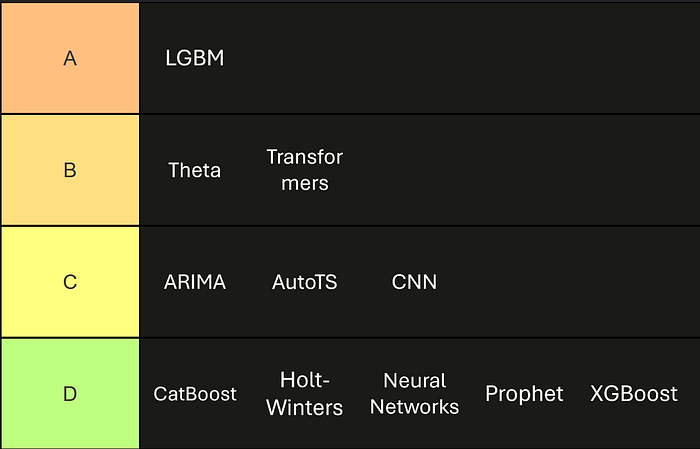
I classified the models used (or not used) from D-Tier (worst) to A-Tier (best).
D Tier
I classified models as D Tier if no one in the top 20 used them.
- Facebook Prophet (and its neural version). Facebook Prophet has been debunked over the last few years as a poor model for forecasting supply chain demand. Nevertheless, you can often see people advocating for it on the internet (or using it as a benchmark). No one in the top 20 used it, and I wouldn’t advise any of my clients to use it.
- XGBoost and CatBoost have not been used by anyone in the top 20. When it comes to boosted trees, all the participants preferred the LGBM implementation. In my experience, XGBoost delivers a similar performance as LGBM but is usually (but not always) slower. On the other hand, CatBoost is less reliable in my limited experience.
- No one in the top 20 used exponential smoothing models (aka Holt-Winters) in their “usual” implementation. I personally like these models: they are easy to understand, implement at scale, and can deliver relatively good results if you tune them adequately.
- Neural Networks. No one used simple (feed-forward multi-layers) neural networks. Unfortunately, these are often relatively slow to run while requiring extensive hyperparameter tuning. At SupChains, we haven’t used neural networks to forecast demand since 2019.
C Tier
C-Tier models are models that have barely been used and are usually only used as part of an ensemble.
- ARIMA was only used by a single team (the winning one), resulting in an extensive running time (4h30) for this team, whereas the other solution ran in less than 10 minutes. I don’t use ARIMA and don’t advise my clients to use it (actually, I coached multiple companies out of ARIMA): it’s extremely slow, and beyond this result in VN1, I have never seen ARIMA delivering value compared to regular exponential smoothing on any supply chain dataset I have seen. Moreover, ARIMA struggles with 0 values (they are everywhere in supply chains) and will have a difficult time understanding shortages and promotions. Note that the winning team used ARIMA in an ensemble of models where ARIMA only accounted for 30% of the overall ensemble.
- A single participant used an automated time series machine learning framework (AutoTS). It didn’t perform especially well compared to other solutions despite requiring an optimization time of 180 hours and more lines of code than most other solutions. I wouldn’t advise my clients to use ML automated framework: it’s too slow and often doesn’t result in accurate forecasts.
- Finally, a single competitor used a Convolutional Neural Net.

B Tier
These are the best models that have demonstrated added value by multiple competitors.
- Two competitors used Transformer models to forecast demand, a new type of model that (to the best of my knowledge) was used for the first time in this forecasting competition. We’ll likely see more and more transformers in the next competitions.
- Four out of 20 competitors used the Theta model, which dates back to early 2000. Theta became famous after achieving the winning position at the M3 competition. For VN1, it seems that the DynamicTheta implementation from Nixtla got a lot of traction and achieved great results with little computation time.
To the best of my knowledge, Theta wasn’t used (successfully) during the M5 or Intermarché competition. Therefore, it is unclear if Theta is making a solid comeback or just happened to work well on this specific dataset.
A Tier
The Best of the Best: Light Gradient Boosted Machine (LGBM)! Most top competitors used it, reporting good accuracy and fast execution. LGBM has already been used by many participants in previous forecasting competitions (M5 and =Intermarché), and it is also our favorite model at SupChains. I would advise that it should be the backbone of your forecasting efforts as well.
Ensembling
Finally, most participants relied on ensembling (different) models: rather than sticking to a single model, they combined the forecasts of different models. They also combined different instances of a single model: as most ML models are inherently stochastic, you can average 10 or 100 forecasts using the same underlying model (many participants used this technique with LGBM).
Ensembling models is nearly guaranteed to deliver better results; it’s as close as you can get to a free lunch.
Conclusion
The success of most of the top participants in the VN1 Forecasting Competition can be attributed to several key factors:
- Structured Framework to Evaluate Models — Establishing a clear and systematic framework to assess model performance was crucial for selecting the best forecasting methods. If you can’t properly assess the quality of your models, you can’t make a great forecasting tool — it’s as simple as that.
- Fast Experimentation — The ability to iterate quickly allowed competitors to try out more models, select better features, and fine-tune their models more effectively.
- Model Exploration — Top performers tested various models and techniques before selecting their final approach.
- Feature Engineering — Creating, testing, and selecting meaningful features proved to be a major differentiator in achieving superior forecast accuracy.
- LGBM — LightGBM emerged as the dominant model delivering great accuracy and speed while being easy to use.
- Ensembling different solutions
Acknowledgments
Philip Stubbs, Ruben van de Geer, Jacopo De Stefani, Thierry Azalbert, Carmen González Camba